NAEPC Webinars (See All):
Issue 47 – October, 2025
What Really Drives Life Insurance Sales? Chasing the Past is No Way to Move Forward
By: William J. Boersma, CLU®, LIC, AEP®
This article will discuss the variation in the sales of distinct types of life insurance over the past five decades and analyzes what is behind the back-and-forth swing in market share. The author has gathered all available data on sales of permanent life insurance and visually represents it in concert with what is concurrently happening in the financial markets to shed light on the often overlooked influence of market trends on life insurance choices. The goal is to provide insights that can help policy owners and advisors make more informed decisions in creating a life insurance portfolio that aligns with their best interests.
The Trap of Chasing Returns
Over 30 years ago, when I first came into the business, I was told that the best way to lose money in investments is to buy the “Best Mutual Funds” listed on the annual cover story of Money Magazine. The point was that too often people chase recent returns, and a high-flying mutual fund is “Best” because, by skill or chance, it has been doing great. However, all asset classes, even cash, are at some point the “high-flyer” and almost certainly will not be the high-flyer moving forward.

Many years ago, it hit me, a lot of marketing is based on recent experience and that explained a lot, but why care where the market has been or even where it is now? Why should life insurance be any different? I started my research almost ten years ago, and the data at that point showed a strong correlation between the market share of different types of life insurance sales and the financial markets. Innovation in the life insurance industry has often been driven by financial markets, as this article will demonstrate.
A Look Back at Life Insurance Trends
In the beginning there was whole life and term insurance. In the seventies, when interest rates were skyrocketing, policyholders started taking their cash value out of stodgy whole life policies and putting it into other investments. I personally recall getting 13% on a savings account when I was a young teenager. If death benefit was not the point of a life policy, then why not chase returns?
To retain, or attract, insurance business, universal life (UL) was created. UL is a “new money rate” product, as opposed to a “portfolio rate” product, so at the time it could credit rates much higher than whole life in a rising interest rate market. A portfolio rate product with its laddered bonds is always going to lag the market, whether money rates are going up or going down, so given where we are in a market cycle, either whole life or universal life might look better.
This creates a potential problem. Unlike with many investment holdings that can be redeployed into other investments easily, life insurance is more of a long hold position. You cannot easily go from product to product because of high early expenses, surrender charges, and underwriting. Either whole life or universal life is going to look better at any given time because of how life insurance projections are created and used. In the life insurance industry, regardless of the type of insurance, the projections presume that the assumptions of today will stay the same forever. While there is an ability to input assumptions less favorably, but never better, than current assumptions, this is not common because inputting lower crediting or high expenses results in a less attractive output and a more difficult sale.
Variable life and indexed universal life (IUL) insurance is different than whole life and traditional UL because crediting is based on investment markets or an index. Regulations institute maximum assumed crediting rates, but too often the assumptions are at or near the allowable maximums.
Static Assumptions
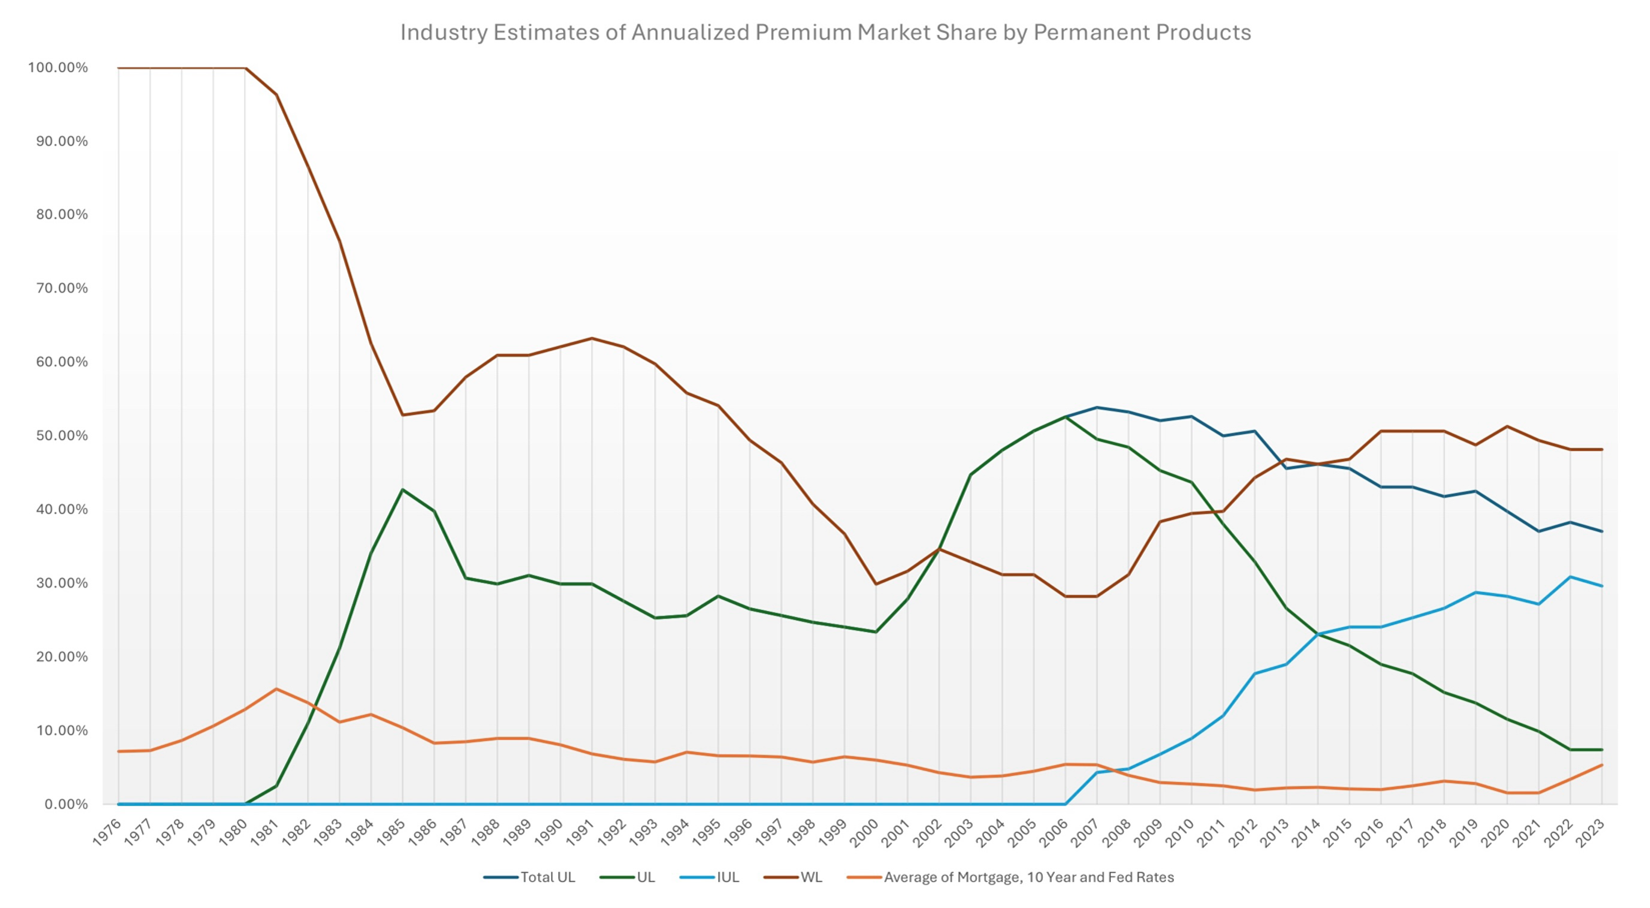
 Either way, the assumption on day one is the same assumption at age one hundred. While some systems allow limited customization, it is rarely done. Software and regulations do not allow Monte Carlo simulations that may help account for the vagaries of the markets and the sequencing and variability of returns.
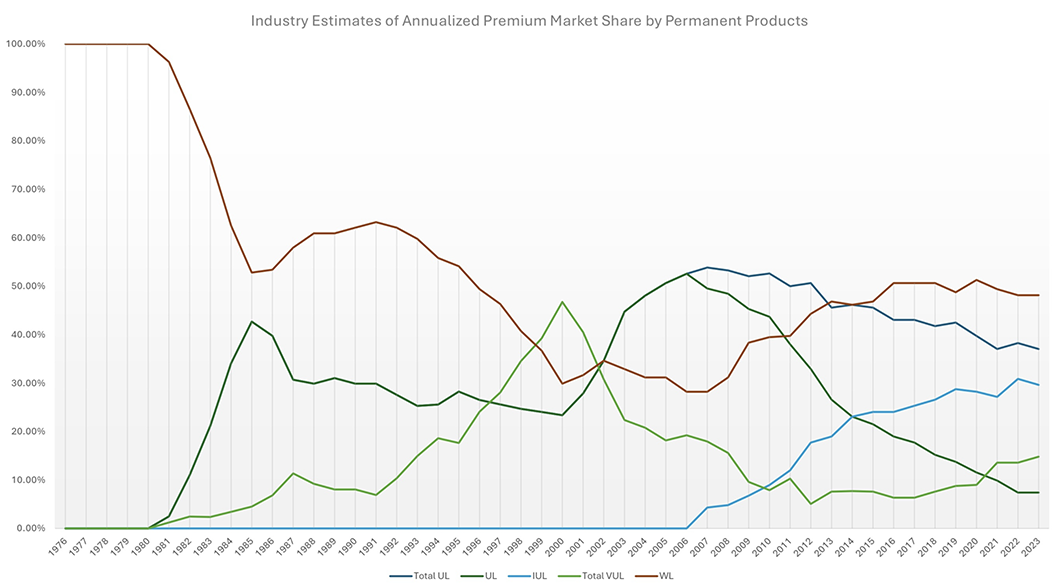
When we look at the graph above, it is evident that the mix of products sold on an annual basis change over time. The question is: why does the mix change the way it does? In this author’s opinion, the mix changes owing to a combination of product innovation and financial markets. And because product innovation itself is driven by financial markets, it is all really driven by financial markets.
Relationship Between Yields and Fixed Product Sales
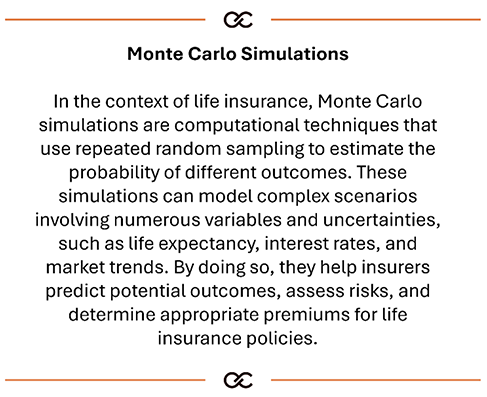
In the next graph I show only whole life and universal life, along with a hypothetical bond/fed rate/mortgage average. Most insurance carrier’s investments are investment grade bonds and high-quality mortgages. These yields are a meaningful factor in the general account return, and the general account return is a significant driver of the crediting rates behind whole life and fixed UL, including IUL.
What is the relationship between WL and UL sales relative to the fixed rates and general account yield? When UL was introduced with new money crediting, it projected to perform much more strongly than whole life. Remember, the assumptions at the point of sale were assumed to stay static forever so UL looked to blow the socks off WL. There were UL policies with crediting rates in the mid teens while whole life was in single digits. If the projections assumed were static, one ran circles around the other.
Yields started coming down in 1982, but the portfolio rate of whole life lagged, so UL sales continued increasing for a few years. The soaring UL sales and plummeting WL sales hit an inflection point in 1985 where WL sales recovered, and UL sales declined. 1986 was the high-water mark for some of the mutual whole life carrier dividend rates in double digits. Did the long-term prospects of either product materially change? No, they simply were projected to look much different. Performance over time would be decided by the financial markets over the coming years.
Introduction of Variable Life
In the meantime, variable life, a true securities-based product, comprised of variable whole life and variable universal life (VUL) came on the scene. The variable market is, and always has been, almost entirely VUL. VUL has had a smaller market share than UL and whole life, except for one significant aberration: a dramatic increase in sales during the nineties while the stock market was on fire. VUL sales fell sharply from its peak as soon as we experienced the dot-com tech bubble bursting. At that point more conservative universal life grew strongly, driven by the introduction of guaranteed universal life (GUL). The decline in whole life sales leveled out until it also started growing in the late 2000s and early 2010s.
From the late eighties until 2000, UL sales were relatively stable with whole life sales giving up ground to variable policies. Whole life sales fell, and variable life sales grew in concert with a booming stock market.
In the mid 2000s whole life and universal life made some gains while variable life took a backseat. Starting in approximately 2007, IUL slowly eroded universal life’s percentage of the market until UL consisted of less than 10% of permanent life insurance sales. IUL existed before 2007 with a small market share.
Hand in Hand
This next chart shows variable life sales against the S&P 500 returns. As would be expected, securities-based life insurance sales increased as stock market results were attractive. As mentioned above, there was a strong continued increase through the nineties that peaked and then fell precipitously after the tech bubble popped.
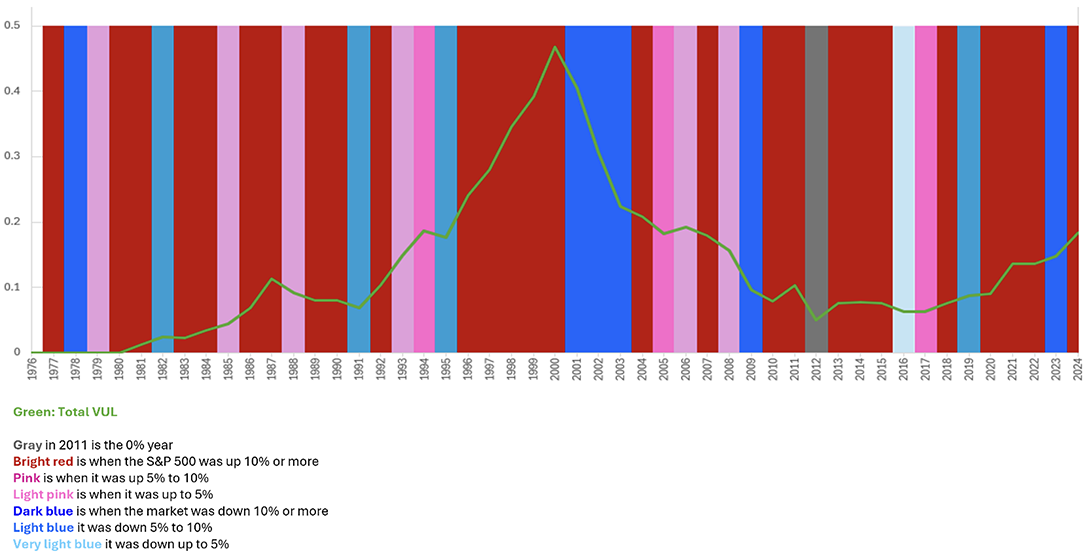
Let us look closely at the relationship between market returns to variable life sales. Besides the huge drop in both after 2000, it is interesting just how closely the two track each other. To see the correlation, simply look at the sales distribution the year after the stock market returns.
VUL was initially driven by the bull market of the early to mid eighties and went gangbusters during the high-flying nineties. It fell off a cliff just as fast from 2000-2002 with the awful markets. Every off-year results in a fall in, or leveling out of, market share. The flat market year of 2011 resulted in a pullback. Even a slightly up market year like 1987 resulted in a fall in sales due to the infamous October 1987 historic stock market drop. The great 2023 market returns drove VUL sales up 17% in 2024.
Surprising?
An apparent aberration is the continued slide in VUL sales during the early 2000s after the stock market turned around, but there are a few explanations for this. First, a continued reaction to the market decline from 2000-2002. You do not easily get over something like that. This happened post the ‘87 crash as well. Another reason VUL sales did not bounce back when the market did in the mid 2000s was due to lingering negative feelings about VUL based on how it was too often irresponsibly built and sold in the nineties.
Yet another reason: the introduction and proliferation of guaranteed universal life (GUL). It’s understood that much GUL of the time was underpriced and looked fantastic. For death benefit focused insurance sales, one need not take the risk of the market when the internal rate of return (IRR) on premium to death benefit at life expectancy was so attractive. It’s important to understand that, unlike VUL of the time, and IUL more recently, there wasn’t an obvious downside to the consumer for mispriced policies; the lowball premiums were guaranteed, which makes those products golden today, much to the chagrin of the carriers that issued them. GUL had its quirks and considerations, but if the contract rules were followed it did not have increasing premium or lapsing policy consequences.
The Effect of GUL & IUL
The tanking stock market did not have much of an effect on whole life sales but look at the spike in UL sales starting in 2001. This is precisely when GUL roared on the scene. It is reminiscent of the whole life/UL relationship twenty years earlier. Upon the integration of IUL stats we see the UL sales fall commensurately with the rise in IUL sales. Why? IUL projections could be made to look fantastic while UL projections could not, like VUL sales in the nineties relative to whole life. Whatever looks better sells better, regardless of the underlying fundamentals.
Surprisingly, variable sales stayed level throughout the 2010s, even though the stock market had some particularly good years. Variable sales tick up more in the early 2020s. Upon closer examination, this is explained by the fact that IUL sales dramatically expanded during that period. It needs to be understood that it was during a period without the regulation we have today, thus allowing illustrated rates to be unreasonably high. The story of upside potential without downside loss was so appealing there was no reason to go into a true securities-based product, even though they were not really the same.
Furthermore, VUL sales did not rise until the 2020s because that is the period when most carriers had pulled their GUL options and IUL projections were tamed by a few iterations of AG49[1] regulation.
The 2024 stats show something else as well. The higher interest rates available pulled sales away from whole life insurance. Check out this comment from LIMRA[2]:
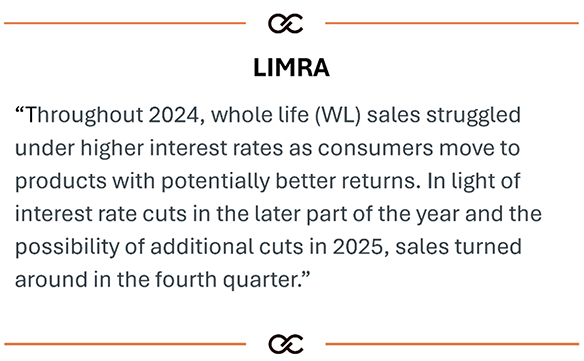
Whole life sales fell early in the year because rising interest rates were competitive, and sales then turned around in the fourth quarter after interest rate cuts. How are sales of a product that is meant to be in force for decades so greatly affected by quarterly changes in market dynamics? It is the antithesis of what an advisor should be trying to accomplish with clients.
The Big Picture
When we synthesize everything in the big picture, what are we seeing? This author sees sales chasing returns – not where returns are going to be, but rather where returns have just been or are right now. It is driving by looking in the rear-view mirror. The investment market is, and always has been, reactive. Fundamentally we know this, but doesn’t it seem more inappropriate for long-term transactions?
Further, it is not consumers chasing returns; its agents selling returns to receptive and easily manipulated consumers. More straightforward, it is easier to sell what looks good on paper. When the stock market is doing well, it is more reasonable and accepted to assume higher returns on the illustration. Those higher returns directly result in lower premiums and/or greater death benefit. When UL crediting rates went down, whole life looked more attractive. When unrealistically grandiose IUL crediting rates materialized, whole life and fixed rate UL looked less attractive.
Regardless of the actual average duration hold of a permanent life insurance policy, a vast majority of new permanent insurance policy owners believe they will hold the policy indefinitely, for decades to come. Why then buy and sell based on what has been happening in the market in the past number of months?
When it comes to asset allocation in one’s investments, you start with risk tolerance and what the client is trying to accomplish: his or her goals. Once you have that, it backs you into the appropriate investments. Why should life insurance be any different?
The fact that whole life sales far exceeded universal life sales in the early nineties and universal life sales far exceeded whole life sales in the mid 2000s is incongruous relative to traditional financial planning tenets. There is no sound reason this should have happened, but there is no surprise that it did because of what was happening in the financial markets and how easy it is to sell a policy projection.
Asset Allocation and Market Predictions
Responsible advisors do not sell growth-oriented equity portfolios to retirees with low risk tolerance simply because the stock market has been on a recent run. And they do not sell CDs and investment grade bonds to young people because interest rates are up, and the stock market is faltering. However, this is precisely what we see in the life insurance world.
Additionally, in the investment world it is not advisable to predict markets when investing for clients. Yet there are some aspects of the life insurance world that those who understand it, and its relationship to financial markets, can see coming. For example, this author could see that whole life dividends would keep going down. However, most policy owners bought based on the current illustrated dividends rates with no idea they would come down. The projected growth and/or limited pay projections were not going to materialize. But would most agents show the effects of a lower dividend rate? Of course not.
Fundamentals Don’t Change – The Need for Better Life Insurance Planning
Lacking significant regulatory changes or product innovations, a client conversation regarding what style of life insurance is appropriate should not be different whether it occurs in 1995, 2005, 2015 or 2025. The fundamentals are the same. It should never be about what product can be made to look better, but what product best fits goals and risk tolerance.
Asset allocation, risk tolerance, needs analysis and the like are all as applicable in life insurance planning as investment planning. As an additional benefit, it quickly freezes out competition who only sell and do not talk intelligently about fundamentals. Think about a client in their thirties with high risk tolerance looking for maximum long-term appreciation who is evaluating life insurance. Imagine one agent steering them towards a conservative, fixed rate product because the stock market was down last year. Envision another insurance professional relating the asset allocation equivalent of life insurance planning and detailing why the higher risk, higher upside product that they intellectually know is the proper way to go is especially attractive now while the market is down, guiding them though emotional squeamishness they may be experiencing due to temporary market turmoil.
It Deserves Better
Life insurance deserves much more attention and application of fundamentals and sound philosophy than it gets. It is not a surprise life insurance agents rank among the least trusted professions.
When this author came into the business in the early nineties, I was taught that over 90% of your portfolio return was due to asset allocation and less than 10% to market timing and investment selection. A quick look at the web as I was writing brought me this:
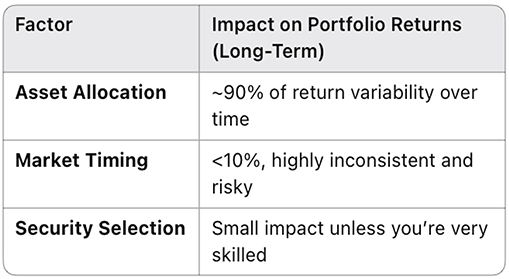
This can be applied to life insurance as well. 90% of what you’ll get out of your policy over time will be based on your choice of whole life, UL, IUL or VUL, and about 10% based on when you buy and what insurance company you buy from.[3] This is neither rocket science nor counterintuitive.
Bill Boersma is a nationally recognized professional in life insurance consulting, analysis, research, and management, with a career dedicated to serving wealthy business owners & professionals and their advisors. Based in Grand Rapids, MI, Bill is the founder and driving force behind OC Consulting Group, where he specializes in estate planning, business succession, and charitable strategies. His expertise is critical to life insurance integrated planning success made possible by his knowledge, experience, attention, and utilizations of tools not available to most consumers and advisors. His work is sought after by estate planning attorneys, CPAs, trust officers, family offices, financial planning professionals and non-profits who value his pragmatic approach and ability to challenge industry orthodoxy.
Bill Boersma is a CLU, AEP, and LIC. More information can be found at www.OC-LIC.com, www.BillBoersmaOnLifeInsurance.info. Call 616-456-1000 or email at bill@oc-lic.com.
Securities offered through Valmark Securities, Inc. Member FINRA, SIPC. Investment Advisory Services offered through Valmark Advisers, Inc., a SEC Registered Investment Advisor. OC Consulting Group and its affiliates are separate entities from Valmark Securities, Inc. and Valmark Advisers, Inc.
[1] Actuarial Guidelines 49
[2] https://www.limra.com/en/newsroom/news-releases/2025/limra-u.s.-individual-life-insurance-premium-exceeds-$16-billion-in-2024-setting-new-sales-record/
[3] Brinson, Hood, and Beebower Study (1986, updated 1991) Ibbotson and Kaplan (2000)